

Subtitle: A clear accounting of automotive interior bonding—from visible and hidden costs to platform standardization.
Introduction: we are not comparing “two adhesives”
When teams discuss replacing spray adhesive with adhesive film, the debate usually slides within five minutes toward one question: “How much does the film cost per square metre?”
The question itself is wrong.
With water-based spray adhesive, the bond line is created on site by the spray gun, atomizing air, gun speed, spray distance, overlap, open time, airflow, temperature and humidity—plus the operator’s experience. The adhesive-weight distribution on every door panel is one sample drawn from all those variables.
Heat-activated adhesive film is fundamentally different. Its thickness, area and boundary have already been defined by coating and die-cutting when the material arrives. The shop-floor tasks are positioning, heat pressing through a temperature/pressure/time window, and cooling under pressure.
This is therefore not a comparison of two adhesives. It is a comparison of two manufacturing systems:
| Dimension | Water-based spray adhesive (6 m²/vehicle, two-sided) | Heat-activated film (3 m²/vehicle, one-sided) |
|---|---|---|
| Bond-line formation | Generated on site; coat weight is an outcome | Predefined; the bond line is an incoming-material characteristic |
| Process chain | Mix and feed → spray both sides → flash/open → laminate → inspect → clean guns/change over | Receive die-cut parts → pre-position → heat activate → cool under pressure → inspect and trace |
| Main variables | Viscosity, solids, atomization, gun speed, airflow, temperature and humidity—distributed and coupled | Converged into a T/P/t window, positioning, surface condition and demould-temperature gate |
| Primary owner | Shop-floor operators and process engineers | Supplier controls thickness/die-cut consistency; plant controls positioning and the heat-press window |
| Bonded area | 6 m²/vehicle | 3 m²/vehicle (half the area) |
A RMB 2 million equipment investment does not buy another adhesive. It buys a measurable, traceable and repeatable bond line. The question is: what is that repeatability worth? We begin with visible costs.
Account 1: visible cost—put both cost curves on the same vehicle
First, fix the boundary. We compare only the difference in bonding processes; the base door-panel processing cost is excluded:
- Monthly spray cost: Cs(Q) = 52.8 × Q + 16,000 (material at RMB 8/m² × 6 m² × 1.1 edge-loss factor; two operators at RMB 16,000/month; existing spray equipment treated as a sunk cost).
- Monthly film cost: Cf(Q,p,s,m) = 3p × Q + 2,000,000 / (60s) + m / 36 (RMB 2 million equipment amortized over five years and tooling over three years; s is the number of vehicle programs sharing the equipment, and m is tooling investment per program).
Four variables describe the model: monthly volume Q, film price p, number of vehicle programs sharing the equipment s, and tooling per program m. The baseline scenario uses p=RMB 15/m², s=1 and m=RMB 100,000.
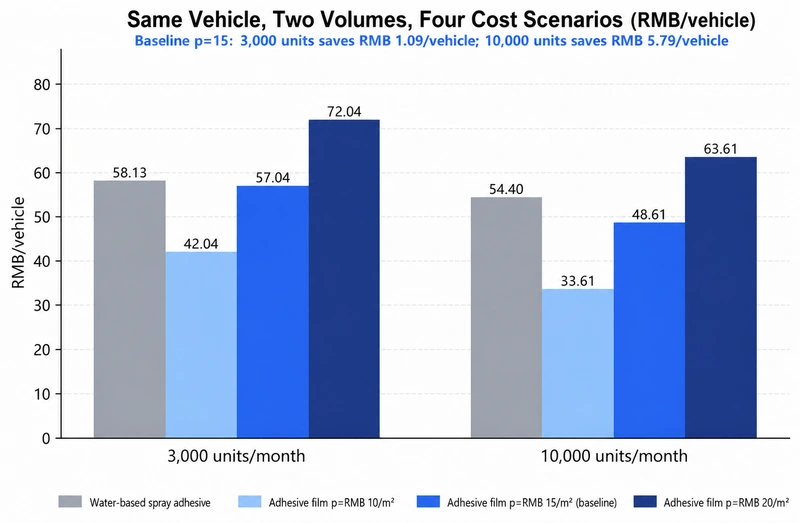
Figure 1 | One vehicle, two volumes and four cost scenarios: price is more sensitive than volume
For the same vehicle, two volumes and four price scenarios make the conclusion clear:
- At 3,000 vehicles/month, the baseline film process costs RMB 57.04/vehicle, only RMB 1.09 less than spray at RMB 58.13/vehicle—nearly break-even.
- At 10,000 vehicles/month, film falls to RMB 48.61/vehicle, saving RMB 5.79 per vehicle.
- At p=RMB 20/m², film loses at both volumes. Price is more sensitive than volume.
Now move to the break-even line:
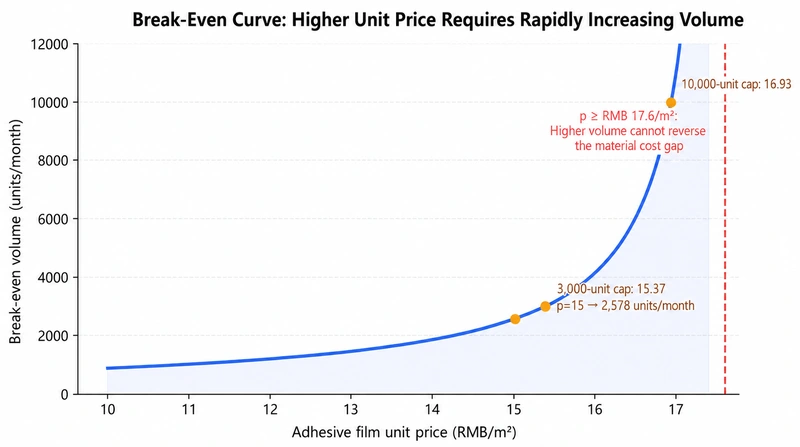
Figure 2 | Break-even line: at p=15, break-even is about 2,578 vehicles/month; at p≥17.6, volume no longer helps
- At p=RMB 15/m², break-even is approximately 2,578 vehicles/month.
- At 3,000 vehicles/month, the maximum acceptable film price is RMB 15.37/m²; at 10,000 vehicles/month, it expands to RMB 16.93/m².
- Once p ≥ RMB 17.6/m², the material-cost difference consumes the entire scale advantage. No increase in volume can recover it.
This is why a purchasing negotiation should treat RMB 15/m² as the target and RMB 16.93/m² as an absolute ceiling in the high-volume scenario—not as a normal quotation.
Account 2: hidden cost—the money missing from the spray ledger
Visible cost is only the tip of the iceberg. A 10% spray edge-loss assumption is far from the whole story. Conventional air-atomized spraying has a typical transfer efficiency of only 25%–40% according to the cited EPA industry reference. Where does the rest go? Masking fixtures, filters and exhaust, drum residue and gun-cleaning waste.
At least four spray-process cost groups routinely sit outside the quotation:
- EHS and compliance: spray booths, ventilation, filtration, ignition-source controls and VOC management. “Water-based” does not mean zero burden; the actual formulation and site emissions still require confirmation.
- Cleaning and waste: gun cleaning, residual adhesive, filtration media, wastewater treatment and downtime during batch changes.
- Quality loss: overspray, insufficient adhesive, rework, scrap, and variation in appearance and durability.
- Utilities: supply and exhaust air, drying, compressed air, filter consumables and maintenance.
How important are these costs? Consider a reversal test:
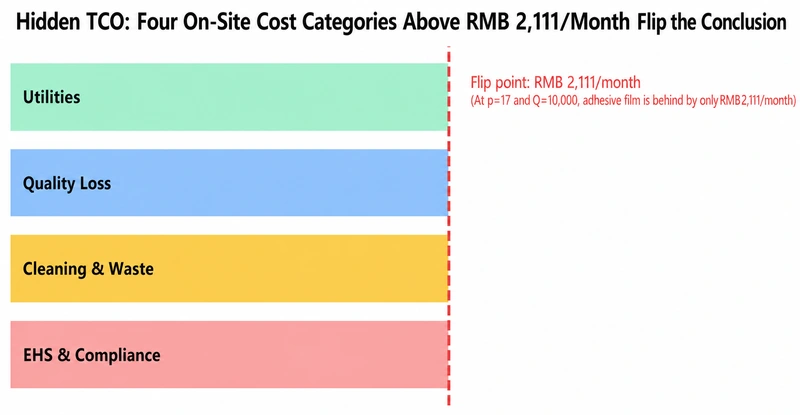
Figure 3 | Hidden-TCO reversal: film becomes preferable when omitted spray costs exceed RMB 2,111/month
Even in the unfavourable scenario of 10,000 vehicles/month and film priced as high as RMB 17/m², visible film cost exceeds spray by only RMB 2,111/month. In other words, as soon as omitted spray TCO exceeds RMB 2,111/month, film becomes the better option. For a spray shop that needs ventilation, filtration, cleaning and waste treatment, that threshold is difficult to dismiss.
Site TCO data collection is therefore not optional refinement. Pull three months of energy, consumables, waste, downtime, rework and scrap records and use them to replace the model’s blank fields. The more complete the accounting, the firmer the film case becomes.
Account 3: process fundamentals—seven advantages must connect root cause → metric → cost
Supporters of adhesive film often make one mistake: they list benefits. The right review question is not how many benefits there are, but whether each benefit has an auditable causal chain—whether it can be measured, entered into the control plan and included in TCO.
| # | Technical root cause | Measurable metric | Hidden cost removed or reduced | New risk |
|---|---|---|---|---|
| 1 | Defined thickness/coat weight | Thickness, coat weight, Cpk | Coat-weight drift, rework, scrap | Incoming batches |
| 2 | Defined shape/boundary | Die-cut dimensions, squeeze-out width | Masking, overspray, cleaning | Tolerance stack-up |
| 3 | Converged process variables | T/P/t window, Cpk | Set-up and operator variation | Heat-press capability |
| 4 | Die-cutting and pre-positioning | Cycle time, WIP, first-pass yield | Spray/flash stations and waiting | Positioning time |
| 5 | Roll/batch labels | Trace time, containment scope | Investigation, isolation, reinspection | Shelf life |
| 6 | No shop-floor spray cloud | Exhaust, filters, gun-cleaning waste | EHS, maintenance, downtime | Release liner |
| 7 | Shareable activation equipment | Utilization, vehicle programs, OEE | Fixed cost per vehicle | Equipment bottleneck |
This definability is especially valuable for transparent decorative parts. Fixed thickness and bounded geometry make haze, yellowing, bubbles, particles and squeeze-out traceable defect mechanisms. Project materials state a controllable film thickness of 40–200 µm, transmission above 99% and ΔYi≤1 after 1,500 hours at 110°C. Supplier statements must, however, be converted into project specifications and measured evidence: “tested” is not the same as “released.”
Account 4: ROI—volume dilutes fixed cost, not film price
From a financial perspective, one concept must be separated cleanly: increased volume dilutes fixed-cost allocation, while material marginal cost does not move at all.
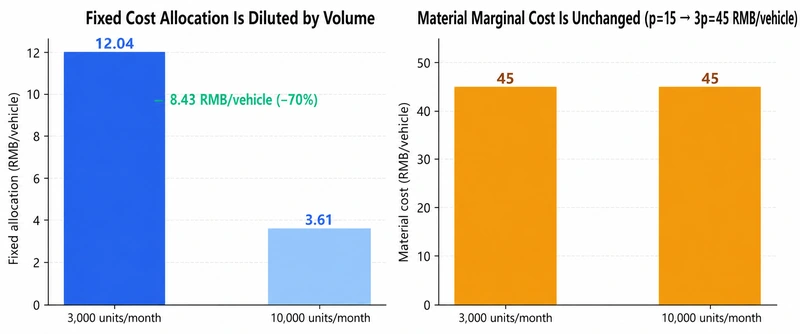
Figure 4 | Volume reduces fixed-cost allocation by 70%; the 3p material marginal cost is unchanged
Between 3,000 and 10,000 vehicles, film fixed-cost allocation falls from RMB 12.04 to RMB 3.61 per vehicle, a 70% reduction. Material remains 3p=RMB 45 per vehicle. Management should assess the benefit of higher volume separately from purchasing price reductions. Securing both levers produces the strongest ROI.
Now consider five-year cash flow at p=15, s=1 and RMB 2.1 million upfront investment:
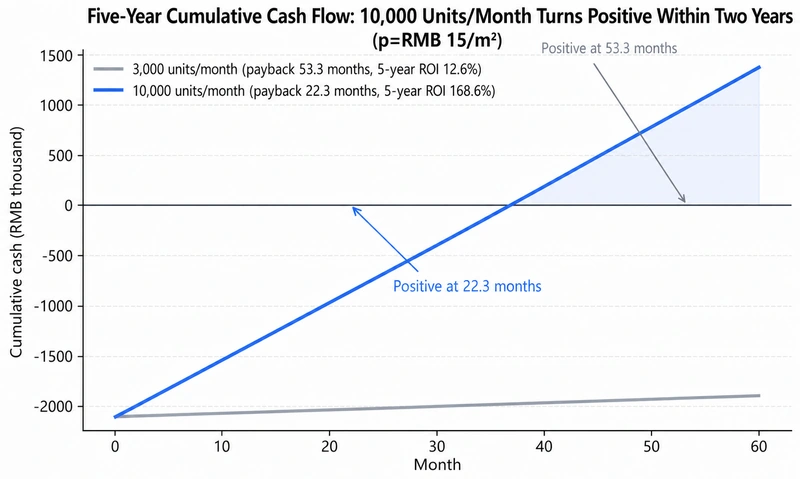
Figure 5 | Five-year cumulative cash flow: 10,000 vehicles/month turns positive in 22.3 months with 168.6% ROI
- 3,000 vehicles/month: simple payback is 53.3 months and five-year ROI is 12.6%. It turns positive, but only marginally.
- 10,000 vehicles/month: simple payback is 22.3 months, five-year cumulative net benefit is about RMB 3.54 million, and ROI is 168.6%.
The conclusion is direct: adhesive film is scale-friendly. Higher volume and a lower locked price improve the return curve.
Account 5: platform standardization—one equipment set shared by several vehicle programs
The film approach contains a frequently underestimated lever: activation equipment can be shared across vehicle programs; tooling cannot.
With each additional program sharing the equipment, allocation of the RMB 2 million equipment cost falls by half and then to one-third. The effect on payback is substantial:
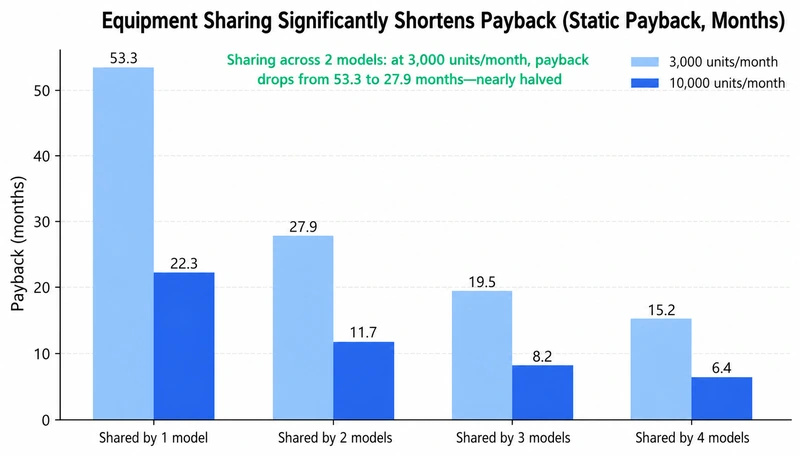
Figure 6 | The platform leverage of shared equipment: two vehicle programs almost halve payback
- One vehicle program with dedicated equipment: payback is 53.3 months at 3,000 vehicles/month.
- Two programs sharing equipment: payback falls to 27.9 months, almost half.
- Three programs: 19.5 months; four programs: 15.2 months.
This is the value of platform standardization: a shared heat-activation platform plus vehicle-specific die-cut tools converts fixed investment into a platform asset instead of a single-program bet. For a low-volume project, securing a second program to share the asset can improve returns more than waiting for volume growth. It also gives process standardization a financial meaning: the same T/P/t window method, traceability system and inspection standard can be replicated across programs.
The other half of the argument: adhesive film can also fail
A responsible article cannot discuss returns alone. Film risks are more concentrated and easier to parameterize, but when heat, pressure, geometry or surface condition do not match, failure can be systematic. Six risks must be closed early:
| Failure mode | Root cause | Early signal | Control |
|---|---|---|---|
| Substrate distortion/optical drift | Excess temperature or non-uniform heat | Warping, dimensional shift, YI change | Lower-temperature delay, insulating fixture, thermal-imaging validation |
| Insufficient bonding in 3D regions | Insufficient local pressure or head compliance | Edge lift, dispersed peel results | Compliant head, zoned pressure, pressure-sensitive film |
| Loss of adhesion on low-surface-energy material | PP surface energy, contamination or treatment decay | Passes initially, drops sharply after aging | Cleaning window, plasma/primer, elapsed-time validation |
| Position/tolerance stack-up | Cumulative die-cut, part and lamination datum error | Bond-line shift, localized exposed edge | GD&T, vision error-proofing, common datums |
| Spring-back/bubbles after release | Insufficient cooling under pressure | Spring-back or released-gas bubbles after opening | Demould-temperature gate and recorded cooling curve |
| Supply and capacity risk | Release liner, MOQ, tooling, equipment bottleneck | Shortage, long changeover, lower OEE | Dual sourcing, safety stock, capacity calculation |
Remember three boundaries: tools cannot be shared across vehicle programs; equipment may become the bottleneck; and repair and disassembly routes require early validation. Film does not mean zero waste. Release liner and die-cut scrap must also be weighed. Only a closed mass balance from purchased material to product and waste reveals the true material loss.
Implementation route: a same-batch A/B pilot with four gates
Do not replace the current process without validation. The appropriate route is a pilot using parts from the same batch, on the same shift and under the same acceptance criteria, closing four gates in sequence:
- Material gate: substrate/film combination and supply assurance.
- Process gate: 3D-window Cpk and equipment capability. Rebuild the T/P/t window with actual substrates; supplier examples are only a DOE starting point.
- Quality gate: peel/shear, aging, VOC/odor, optical and appearance acceptance criteria.
- Economic gate: site TCO, locked price, shared utilization and payback.
The route can be completed in four weeks: W1 locks the process window, W2 covers performance and durability, W3 covers cycle time and yield, and W4 reviews TCO. The output is one of three production decisions—approve, adjust or stop. If any gate remains open, financial return must not be turned into a production commitment.
Conclusion: three approval red lines and one pass
The model can be reduced to three statements:
- Lock price: formal film quotation ≤ RMB 15/m², keeping the low-volume scenario inside the safe zone.
- Lock sharing: at least two vehicle programs share the activation equipment, turning fixed investment into a platform asset.
- Lock validation: introduce conditionally only after all four gates close. If a single-program case requires 36-month payback, the monthly threshold is about 5,427 vehicles.
In the spray era, we “hoped” for the right coat weight on every door panel. In the film era, coat weight is signed off on the incoming-inspection report. The move from on-site generation to predefined layers, from coupled variables to a controlled window, and from single-program amortization to shared platforms is not simply a material replacement. It is an upgrade to the manufacturing system.
The calculation is complete. The next step is to let the data speak.
Want to calculate film ROI for your project? Use the RELANET online calculator.
Discuss your door-panel project with the RELANET technical team:
- Telephone: +86 20 3160 0614
- Email: info@relanet.com.cn
- Website: www.relanet.com.cn
Reference basis: EPA information on spray transfer efficiency; heat-activated film technical literature from 3M, tesa, Bostik and H.B. Fuller; GB 33372-2020, GB/T 27630-2011, HJ/T 400-2007 and GB/T 40726-2021. Financial figures are project simulations and do not constitute an investment commitment.