
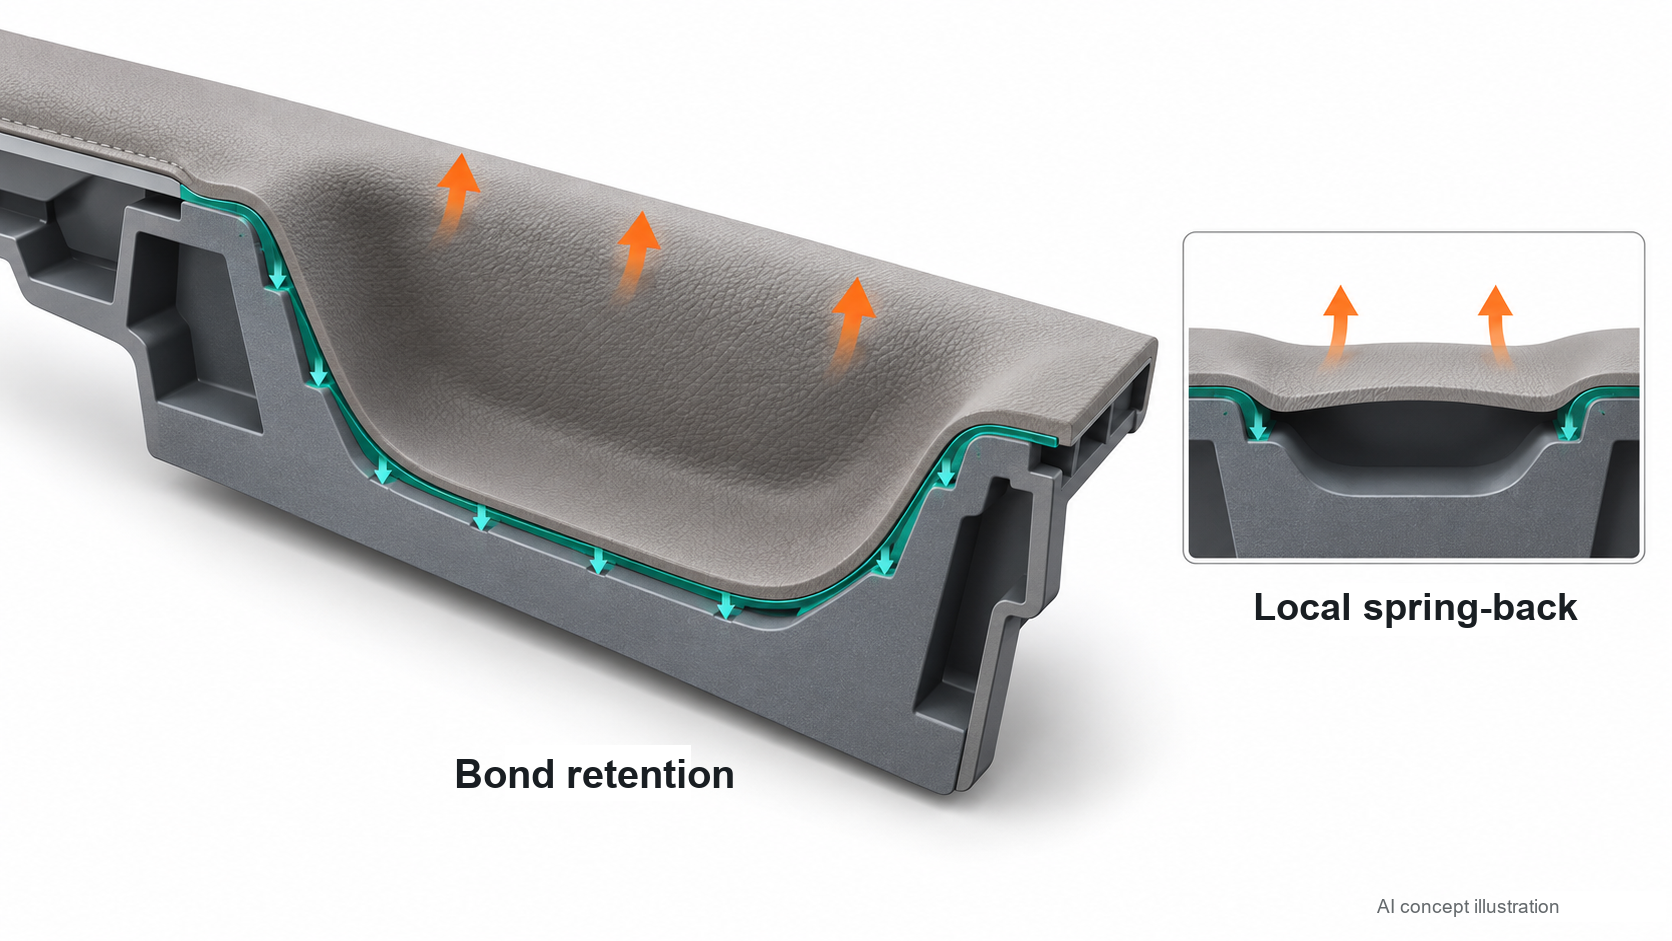
Why deep recesses place greater demands on initial tack
As the skin follows a recess, it stretches and bends. When the pressing fixture is released, the skin still tends to recover its original shape. If the adhesive cannot hold it, the skin may bridge across the bottom of the recess or lift at the edges. Deep recesses, small corner radii and composite skins with greater spring-back are more likely to expose this problem.
Higher initial tack helps the skin remain bonded after fixture release and is particularly useful for short-cycle wrapping. It also requires suitable skin positioning, uniform adhesive application and adequate drying. Changing to a high-tack adhesive alone is unlikely to solve a local area that was not pressed into contact.
This comparison evaluated RELANET R-5670 waterborne polyurethane adhesive against two waterborne controls, identified as FL063 and XK252, using the same process. Under these materials and process conditions, R-5670’s average peel force at both 1 and 5 minutes exceeded three times that of either control. At 8 hours, FL063 recorded the higher value.
First check whether materials and processes are comparable
All three adhesives were tested on flame-treated Shitian AS4 PP boards and Benecke Yunwu single-grid PVC skin, prepared under the same drying and pressing conditions. The following conclusions apply to this material combination.
| Item | Conditions in this comparison |
|---|---|
| PP board | Shitian AS4 board (flame-treated) |
| Skin | Benecke Yunwu single-grid PVC |
| Mixing ratio | All three adhesives: adhesive ∶ hardener = 100∶5 |
| Application area per side | 150 × 100 mm |
| Drying | 80℃, 5 minutes |
| Pressing | Pressed immediately after drying; recorded load 20 kg, held for 30 seconds |
| Peel conditions | 25 mm; 200 mm/min; 180° reverse peel |
| Test times | 1 minute, 5 minutes and 8 hours; 1-minute timing starts at the end of pressing |
| Comparison metric | Average force over the peel interval; cohesive failure in all groups |
20 kg is the recorded pressing load, and 80℃ is the oven drying setpoint. Specimen temperature at the start of peeling was not recorded.
Actual adhesive amounts were similar across the three groups
| Adhesive | PP side: amount g / application rate g/m² | PVC side: amount g / application rate g/m² | Total on both sides g |
|---|---|---|---|
| R-5670 | 1.63 / 108.7 | 1.62 / 108.0 | 3.25 |
| FL063 | 1.65 / 110.0 | 1.70 / 113.3 | 3.35 |
| XK252 | 1.53 / 102.0 | 1.65 / 110.0 | 3.18 |
Total application on both sides ranged from 3.18 to 3.35 g; R-5670 used 3.25 g. Amounts were similar but not identical. Application rates were calculated from the area of one side. The weighing records do not specify wet or dry adhesive, and solids content was not provided, so equal dry-film thickness cannot be assumed.
How to read this comparison
The following comparison uses average peel force to assess initial tack. There is one report record for each adhesive at each time point, and each average is calculated over the peel interval of a single specimen. The data describe this test; additional specimens are needed to verify repeatability and batch consistency.
All specimens were 25 mm wide. Peel strength per unit width is expressed in N/mm. Actual deep-recess parts still require retention testing on the finished part.
Differences in peel force during the first few minutes
At 1 minute, R-5670’s average peel force was 34.748 N, compared with 9.601 N for FL063 and 11.018 N for XK252. At 5 minutes, R-5670 reached 35.901 N and remained above both controls.
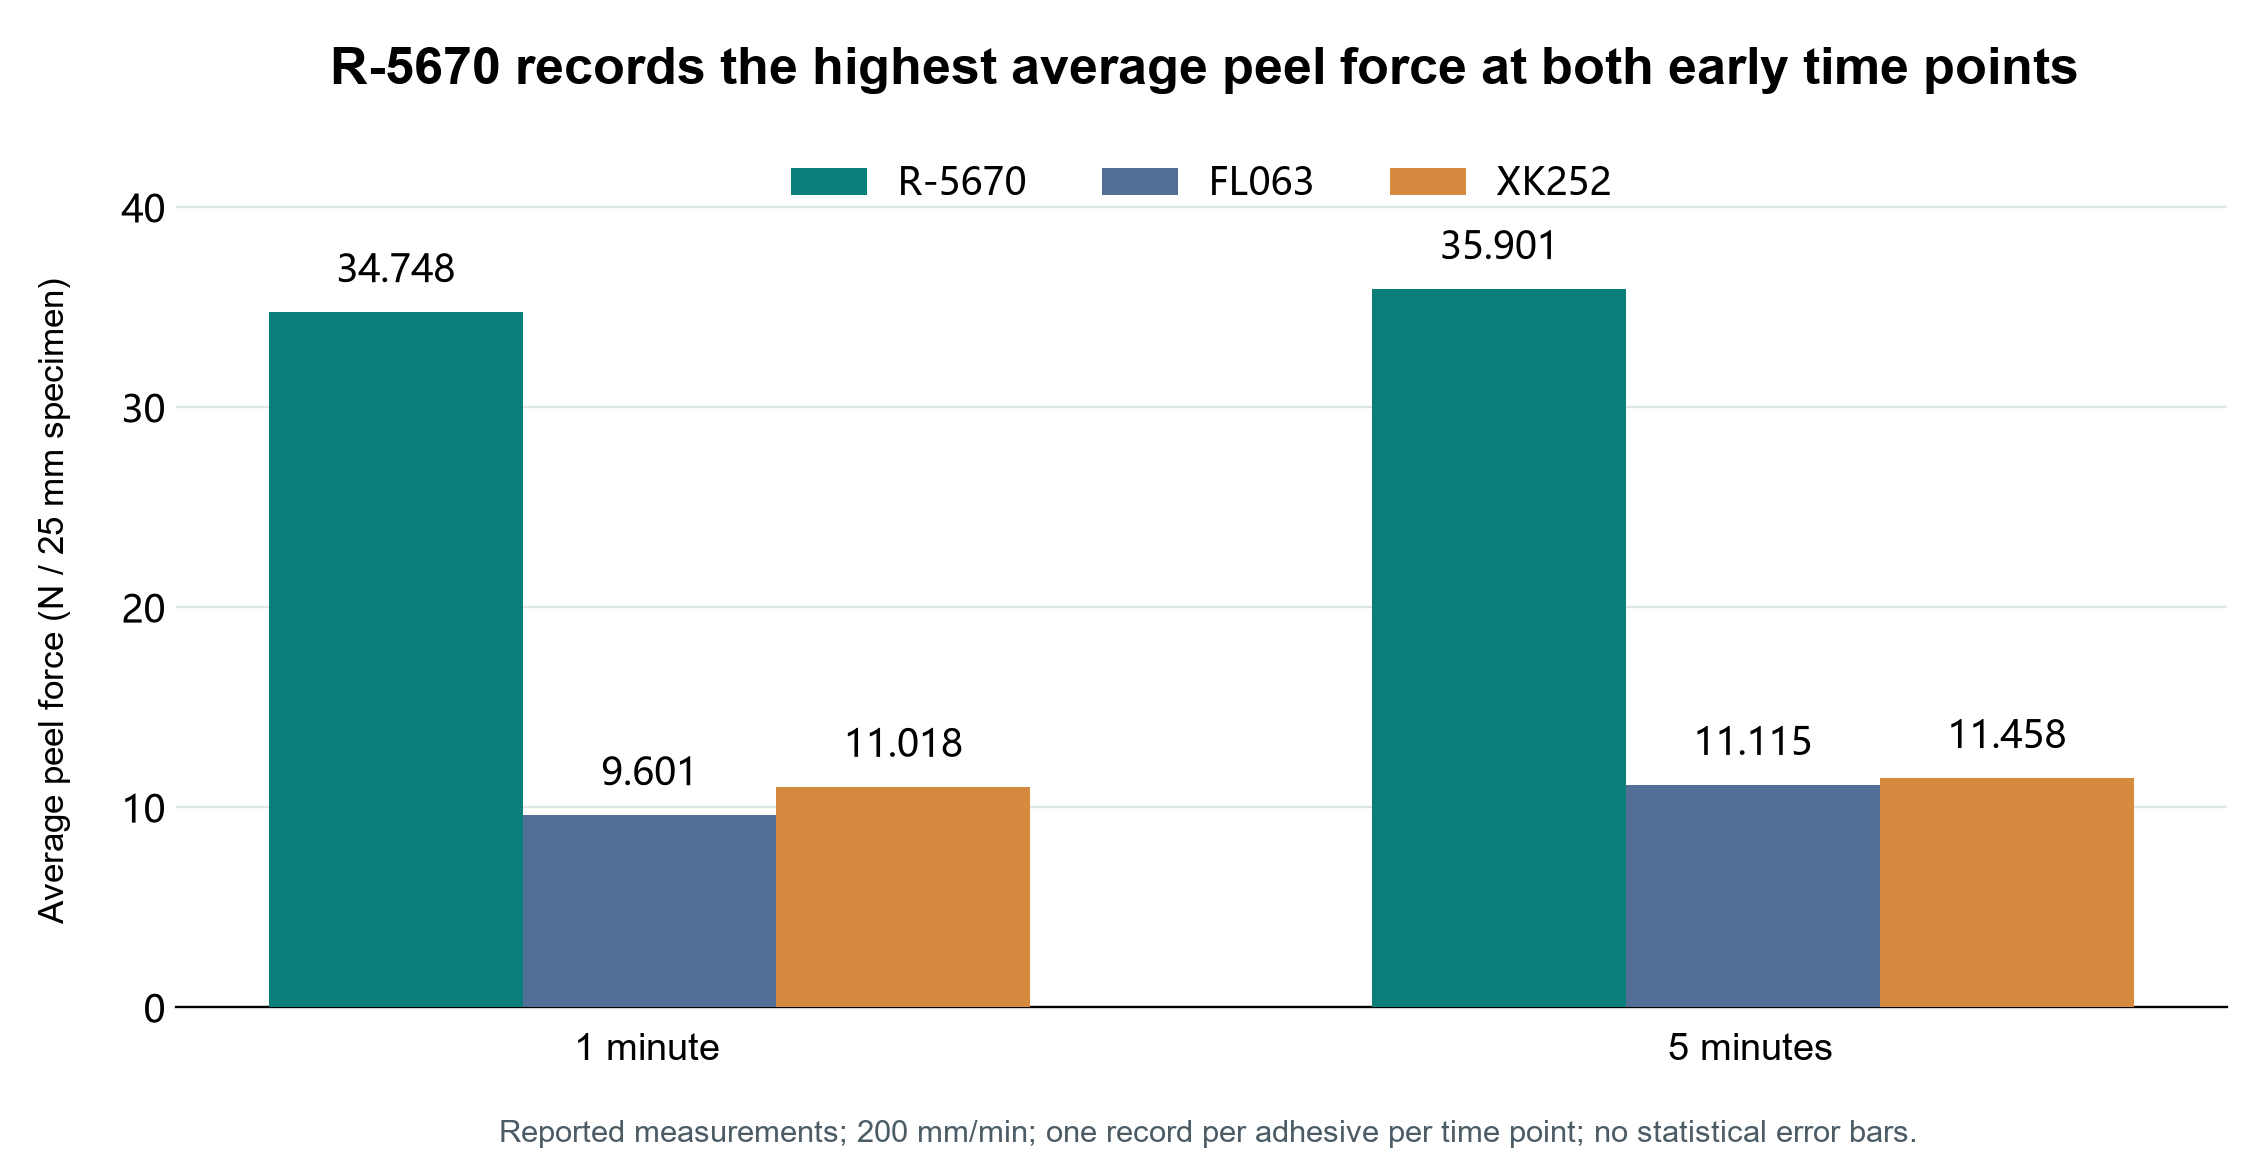
| Adhesive | 1-minute average force N | 5-minute average force N |
|---|---|---|
| R-5670 | 34.748 | 35.901 |
| FL063 | 9.601 | 11.115 |
| XK252 | 11.018 | 11.458 |
Based on average force, R-5670 was 3.62 times FL063 and 3.15 times XK252 at 1 minute; at 5 minutes, the ratios were 3.23 and 3.13 respectively. At both early time points, R-5670 had already developed greater resistance to peeling.
What this means for deep-recess wrapping
Skin spring-back begins as soon as the fixture is released. Higher early peel force indicates greater ability to resist local lifting and warrants priority evaluation for deeper recesses, tighter turns or earlier fixture release.
For development teams balancing design freedom with production cycle time, R-5670’s appeal is the peel resistance developed soon after pressing. It can be prioritized for evaluation on the target recess and edge-wrapping design. Observe bond retention after fixture release before deciding the holding time and transfer cycle.
The ranking changed at 8 hours
After 8 hours, average peel force was 52.175 N for FL063, 31.606 N for R-5670 and 9.380 N for XK252. At this time point, FL063 exceeded R-5670, while R-5670 remained above XK252.
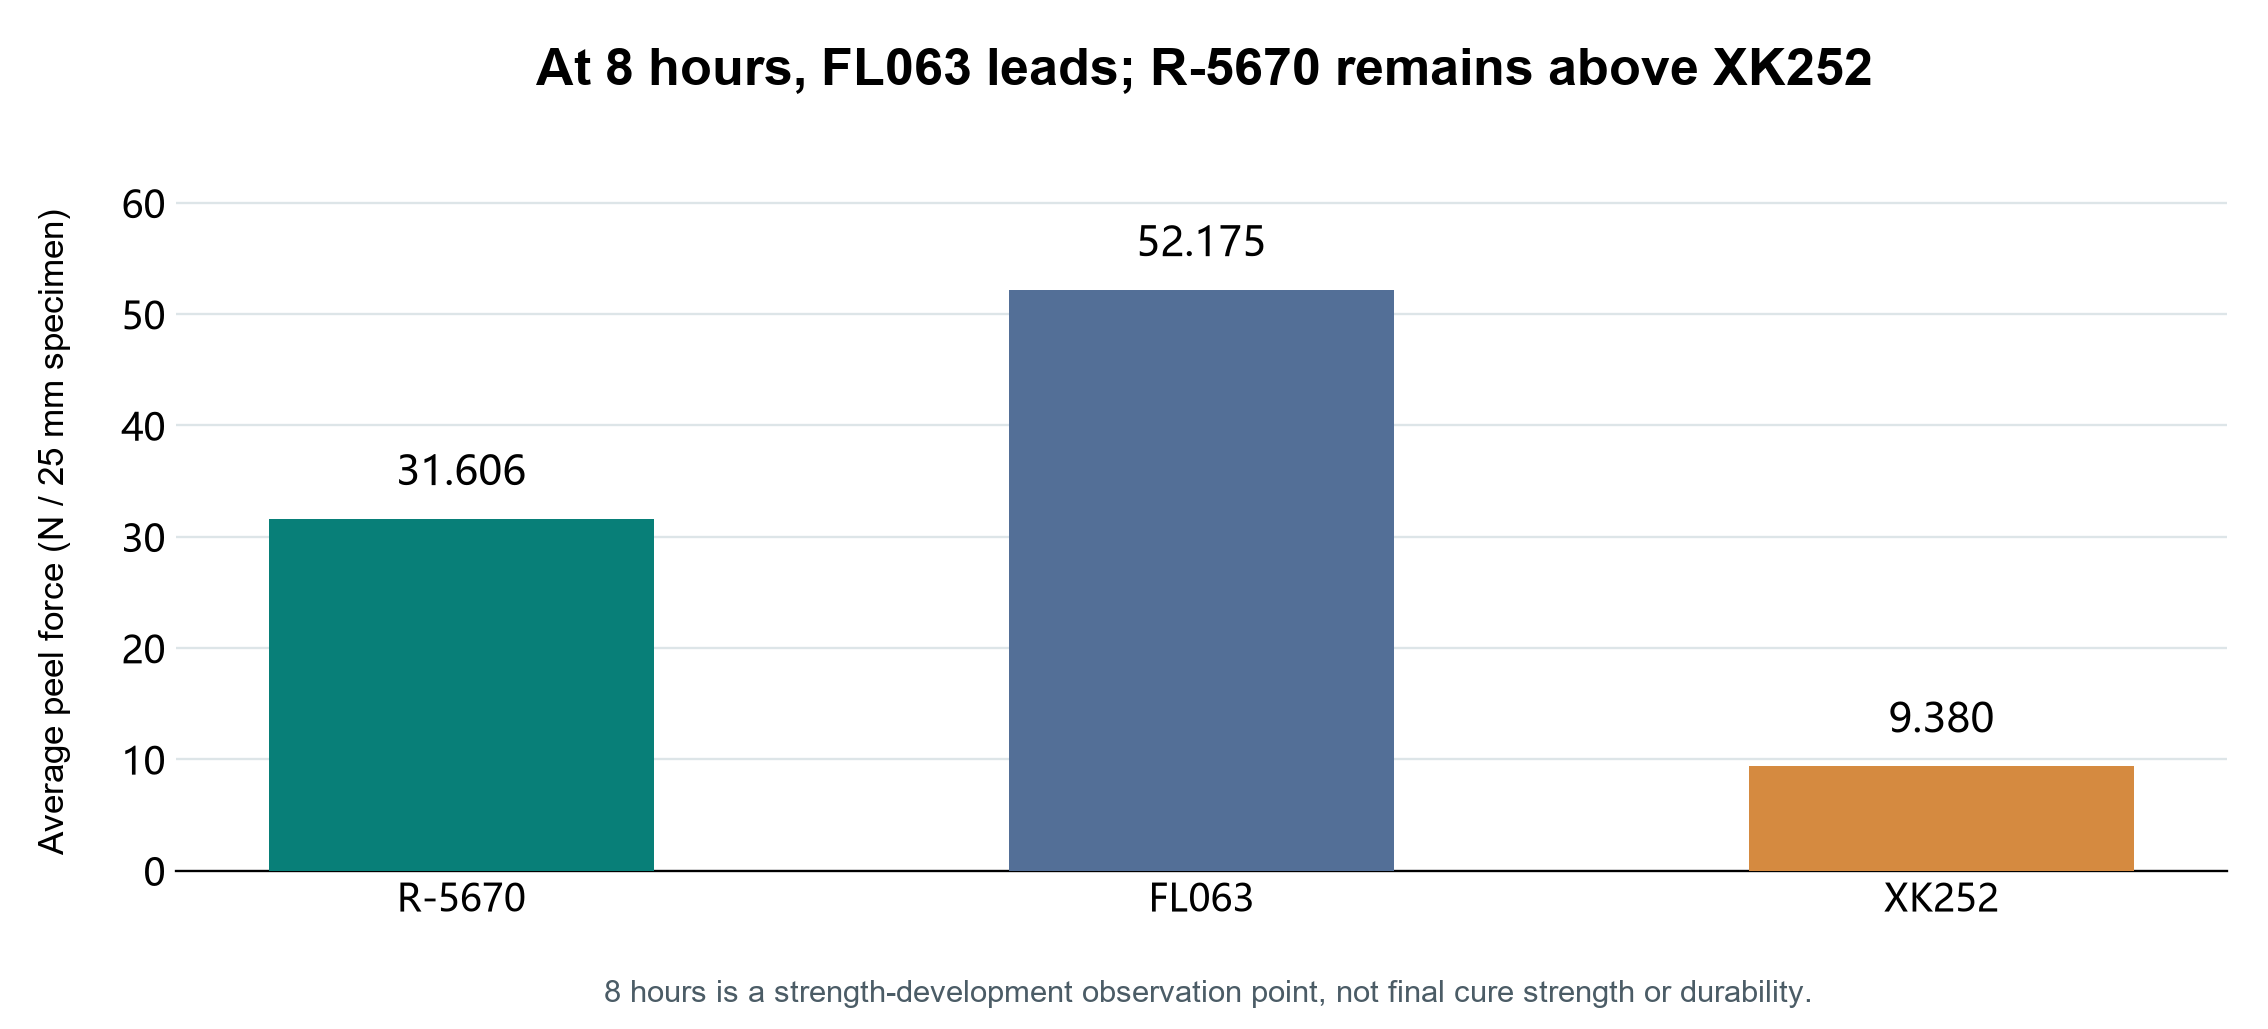
| Adhesive | 8-hour average force N | Peel strength per unit width N/mm |
|---|---|---|
| R-5670 | 31.606 | 1.264 |
| FL063 | 52.175 | 2.087 |
| XK252 | 9.380 | 0.375 |
R-5670’s 8-hour record was below its 5-minute record. All groups showed cohesive failure, but with only one record at each time point, the difference requires retesting. The 8-hour results do not replace final-strength or durability evaluation.
Selection conclusion
If the project prioritizes holding the skin during the first few minutes after pressing, these data support evaluating R-5670 first: its average peel force at 1 and 5 minutes was 3.13–3.62 times that of the two controls.
FL063’s higher peel force at 8 hours should also be considered in adhesive selection. The final choice must account for bond retention, heat resistance and moisture resistance on the actual part.
To evaluate R-5670, request technical documents and samples through the RELANET website. Provide material grades, part geometry and the target cycle time so the application engineering team can discuss a suitable validation plan.
Data source: nine peel reports dated 2026-09-22 and the accompanying adhesive-amount table supplied by the company. Specimen width, materials, pretreatment, peel method, failure mode and mixing ratio were confirmed by the company. Figure 1 is an AI concept illustration; Figures 2 and 3 were plotted from the reported data.